A second set of rental rules in Ontario are set to take effect Sept. 21. Here is a link to Ontario Tribunals Page with information on the changes. The same information is presented here by the

Dated: September 8 2023
Views: 10
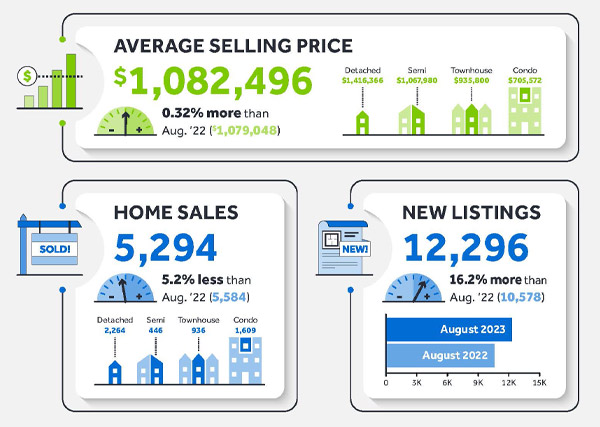
I know that statistics aren't everyone's favourite... but I love them. If you prefer to dicuss the below stats, give me a call. If you like to dive deep, this blog is for you:
Numbers provided by the Toronto Regional Real Estate Board (TRREB) show a drop in sales in August compared to August 22. TRREB cites uncertainty about the economy, high interest rates and fewer available listings for this decline. Year-over-year selling prices remained relatively unchanged with seasonally adjusted prices taking a small dip.
“Looking forward, we know there will be solid demand for housing – both ownership and rental – in the Greater Toronto Area (GTA) and broader Greater Golden Horseshoe,” says TRREB President Paul Baron. “Record immigration levels alone will assure this. In the short term, we will likely continue to see some volatility in terms of sales and home prices, as buyers and sellers wait for more certainty on the direction of borrowing costs and the overall economy.”
In the GTA there were 5,294 sales in August 2023 – down 5.2% compared to August 2022. New listings rose 16.2 per cent on a year-over-over basis which provided much needed inventory, but year-to-date listings are still down compared to last year. Seasonally adjusted sales were down one per cent month-over-month compared to July 2023, while new listings were up slightly by 1.3 per cent compared to July.
The average year-over-year selling price for all homes was up by less than one per cent to $1,082,496.
If we dig a bit deeper, a comparison of the GTA vs Toronto market shows a sllight differencein the markets. There was a larger drop in detached and semi-detached homes sales in the 905 versus the 416. Detached sales dropped 11.2% in the 416 and by 12.2% in the 905. Semi-detached homes dropped 12.7% in the 416 versus a 15.2% drop in the 9095. Townhouse sales increased 15.6% in the 416 area but dropped in the 905 by 2.9%. In the 905 condo sales increased 10.1% and 6.5% growth in the 416 region.
Year-over-year prices in the GTA for houses increased 3.8% but dropped .8% in the 416. Semi-detached prices increased 9.4% in the 416 while there was a 5.4% rise in prices in the 905. Townhouses grew 6.2% in the 416 and 3.1% in the 416. Condos were down 1.8% in the 416 but average prices increased in the GTA by 1.6%.
Feel free to reach out to me to get more granular numbers on your community, neighbourhood or street.

I’m very excited to be partnering with Bosley Real Estate to provide you with the exceptional, professional representation you need to protect and promote your best interests. Bosley Real Estate....
A second set of rental rules in Ontario are set to take effect Sept. 21. Here is a link to Ontario Tribunals Page with information on the changes. The same information is presented here by the
Canada’s federal ban on foreign homebuyers is scheduled to expire January 1, 2027. With the deadline approaching, the government has yet to confirm whether it plans to extend the restrictions
According to recnt numbers from the Toronto Regional Real Estate Board (TRREB), Toronto home prices continued to soften in July, but the bigger story may not be the decline in prices. It may be what
For the first time in five years, average home prices in the Greater Toronto Area have slipped below the $1 million mark — a meaningful psychological and financial milestone that signals a
Should you require assistance in navigating our website or searching for real estate, please contact our offices at 416-322-8000.
 Toronto Real Estate Board (TRREB); All information deemed reliable but not guaranteed. All properties are subject to prior sale, change or withdrawal. Neither listing broker(s) or information provider(s) shall be responsible for any typographical errors, misinformation, misprints and shall be held totally harmless. Listing(s) information is provided for consumer's personal, non-commercial use and may not be used for any purpose other than to identify prospective properties consumers may be interested
in purchasing. The data relating to real estate for sale on this website comes in part from the Internet Data Exchange program of the Multiple Listing Service. Real estate listings held by brokerage firms other than Bosley Real Estate Ltd. may be marked with the Internet Data Exchange logo and detailed information about those properties will include the name of the listing broker(s) when required by the MLS. Copyright ©2026 All rights reserved.
Last Updated: September 23, 2026 2:47 PM UTC
Show More...
Toronto Real Estate Board (TRREB); All information deemed reliable but not guaranteed. All properties are subject to prior sale, change or withdrawal. Neither listing broker(s) or information provider(s) shall be responsible for any typographical errors, misinformation, misprints and shall be held totally harmless. Listing(s) information is provided for consumer's personal, non-commercial use and may not be used for any purpose other than to identify prospective properties consumers may be interested
in purchasing. The data relating to real estate for sale on this website comes in part from the Internet Data Exchange program of the Multiple Listing Service. Real estate listings held by brokerage firms other than Bosley Real Estate Ltd. may be marked with the Internet Data Exchange logo and detailed information about those properties will include the name of the listing broker(s) when required by the MLS. Copyright ©2026 All rights reserved.
Last Updated: September 23, 2026 2:47 PM UTC
Show More...